Admin users with sufficient permissions can view insights and trends for a selected date range for their workspace using the Coro Insights page.
Managed Service Provider (MSP) admin users with sufficient permissions can view and monitor aggregated security activity for a selected date range across their organization's parent and descendant workspaces using the global Coro Insights page.
Use the date range dropdown to choose the time period for your insights. You can also select the Last 30 days or Last 3 months presets:
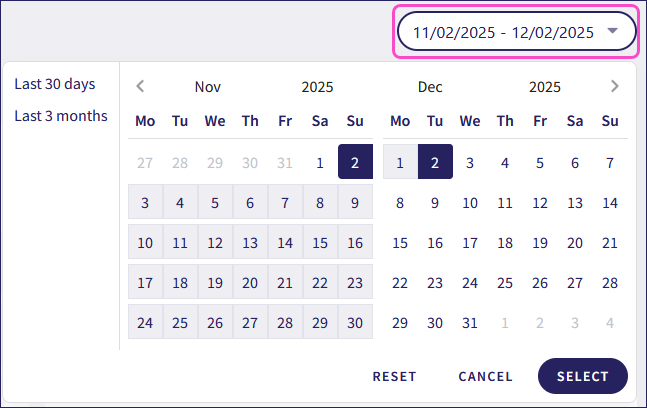
Coro calculates percentage trends by comparing your selected date range to the preceding period with the same number of days.
For example, if you select 09/01/2025 - 10/01/2025 (30 days), Coro compares it to the 30 days immediately before 01 September, 2025.
Coro also limits date ranges to a maximum of 92 days.
Use the panels in the following sections to explore incidents, identify patterns, and drill down into related tickets from each summary:
Your workspace must have Coro User Data Governance enabled to view access permission violation information.
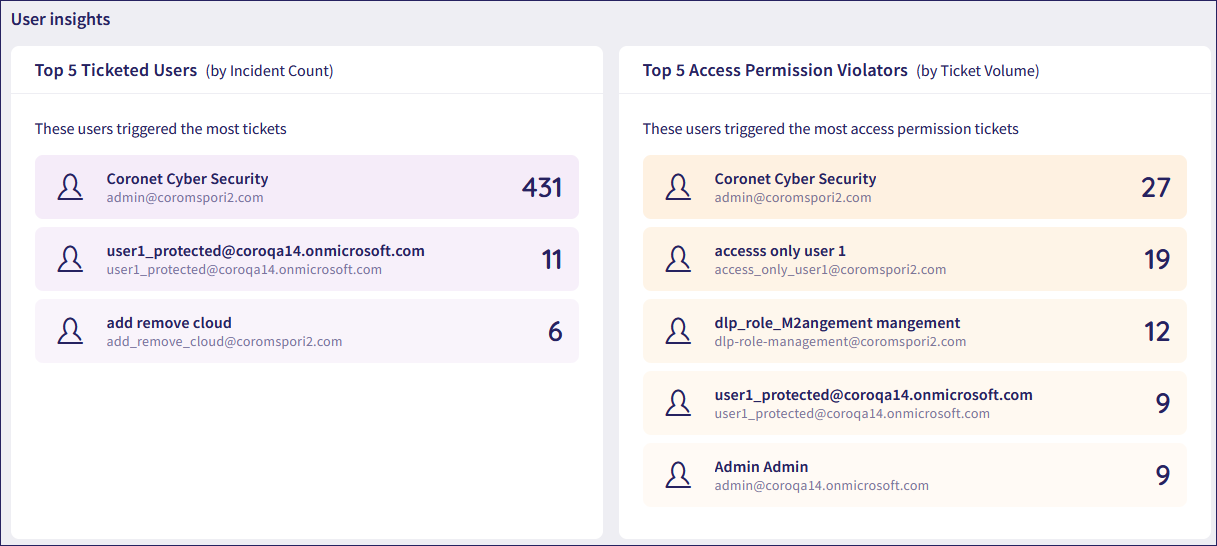
Use the User insights section to view protected users with the highest ticket volumes or repeated access permission violations during your selected date range.
The User insights section includes the following panels:
| Panel | Description | Actions |
|---|---|---|
| Top 5 Ticketed Users | Shows protected users in your workspace who triggered the most tickets during your selected date range. The panel shows the user's name, email address, and their total ticket count. | Select a user to open the Ticket Log showing their tickets for the selected date range. |
| Top 5 Access Permission Violators | Shows protected users in your workspace with repeated access permission violations for your selected date range. The panel shows the user's name, email address, and their total User Data Governance ticket count. | Select a user to open the Ticket Log showing their tickets for the selected date range. |
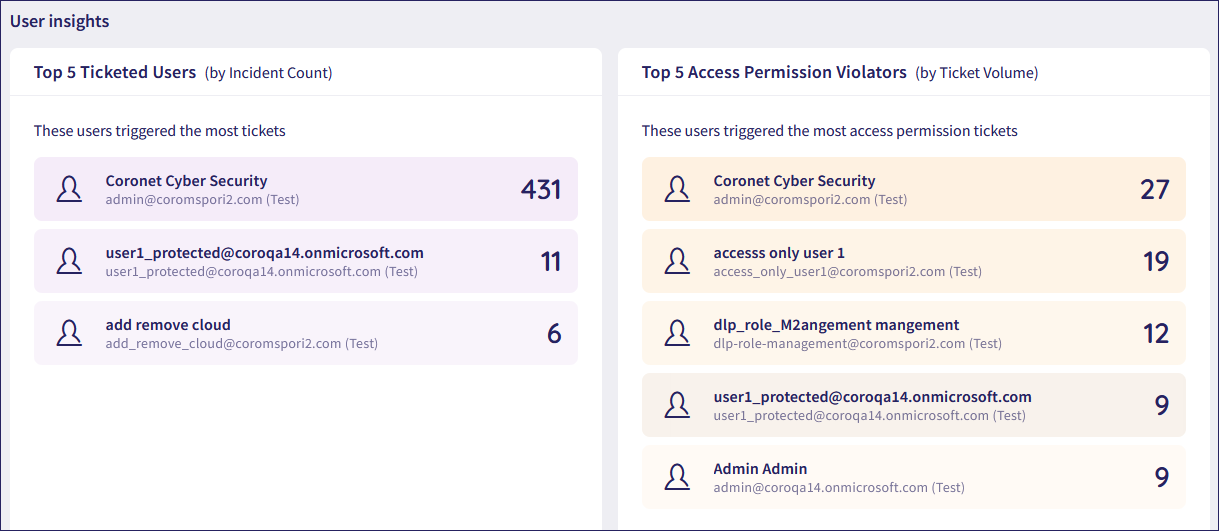
In global view, the User insights section includes the following panels:
| Panel | Description | Actions |
|---|---|---|
| Top 5 Ticketed Users | Shows the protected users in your organization's workspaces who triggered the most tickets during your selected date range. The panel displays each user's name, email address, workspace name, and their total ticket count. | Select a user to open the Global Ticket Log showing their tickets for the selected date range. |
| Top 5 Access Permission Violators | Shows the protected users in your organization's workspaces with the most repeated access permission violations for your selected date range. The panel displays each user's name, email address, workspace name, and their total User Data Governance ticket count. | Select a user to open the Global Ticket Log showing their tickets for the selected date range. |
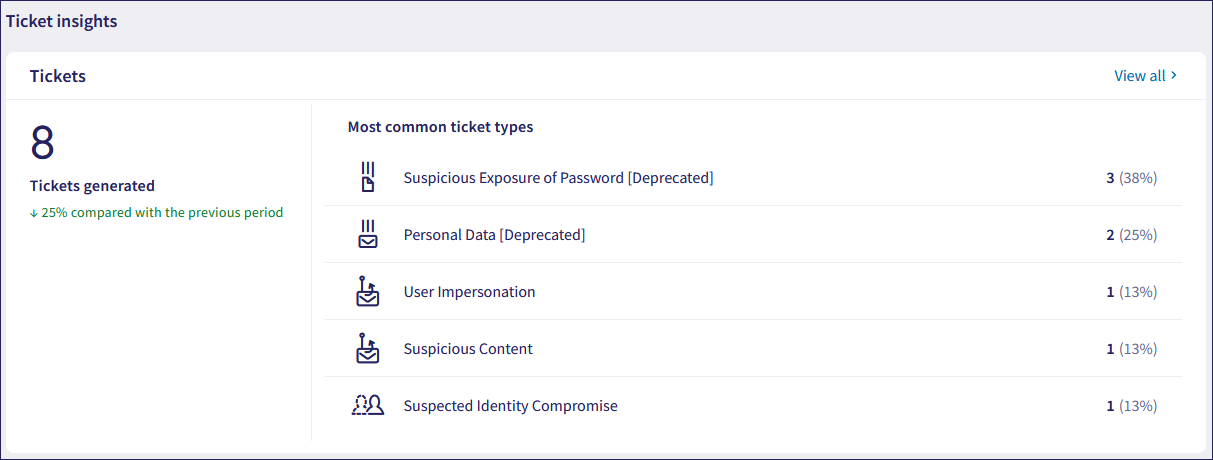
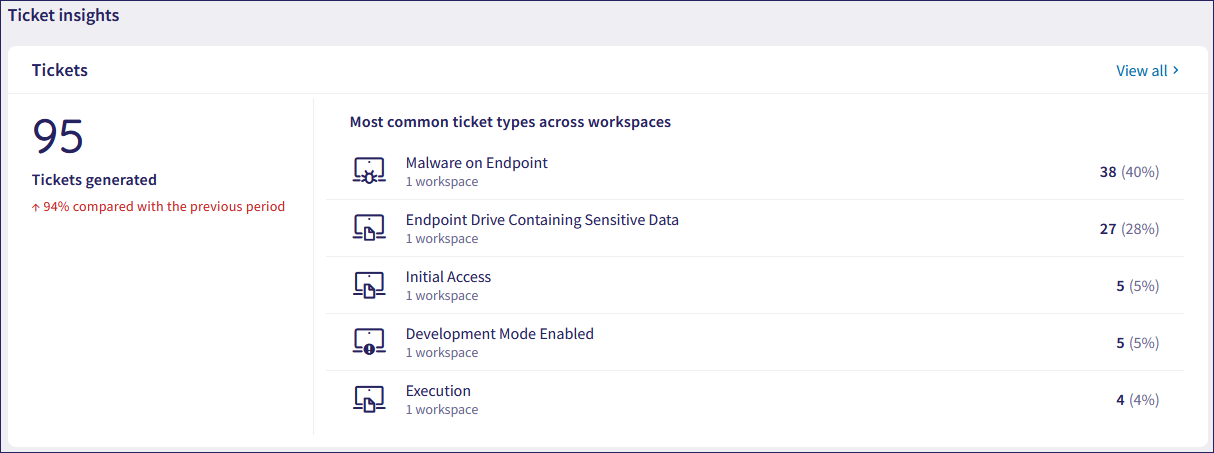
Use the Ticket insights section to monitor ticket trends and identify the most frequent ticket types created during your selected date range.
The Ticket insights section includes the following panels:
| Panel | Description | Actions |
|---|---|---|
| Tickets | Shows the total number of tickets Coro created in your workspace during your selected date range, along with a percentage trend compared to the previous period. The Most common ticket type list shows the top ticket categories by volume, including the ticket count and each category's percentage of total tickets in the workspace. | Select a ticket type to open the Ticket Log filtered by that type for your selected date range. Select View all to open the Ticket Log for all tickets that Coro created in your workspace during your selected date range. |
In global view, the Ticket insights section includes the following panels:
| Panel | Description | Actions |
|---|---|---|
| Tickets | Shows the total number of tickets Coro created across your organization's workspaces during your selected date range, along with a percentage trend compared to the previous period. The Most common ticket types across workspaces list shows the top ticket categories by volume, including the number of affected workspaces, total ticket counts, and each category's percentage of tickets across all workspaces. | Select a ticket type to open the Global Ticket Log filtered by that type for your selected date range. Select View all to open the Global Ticket Log for all tickets that Coro created across all workspaces during your selected date range. |
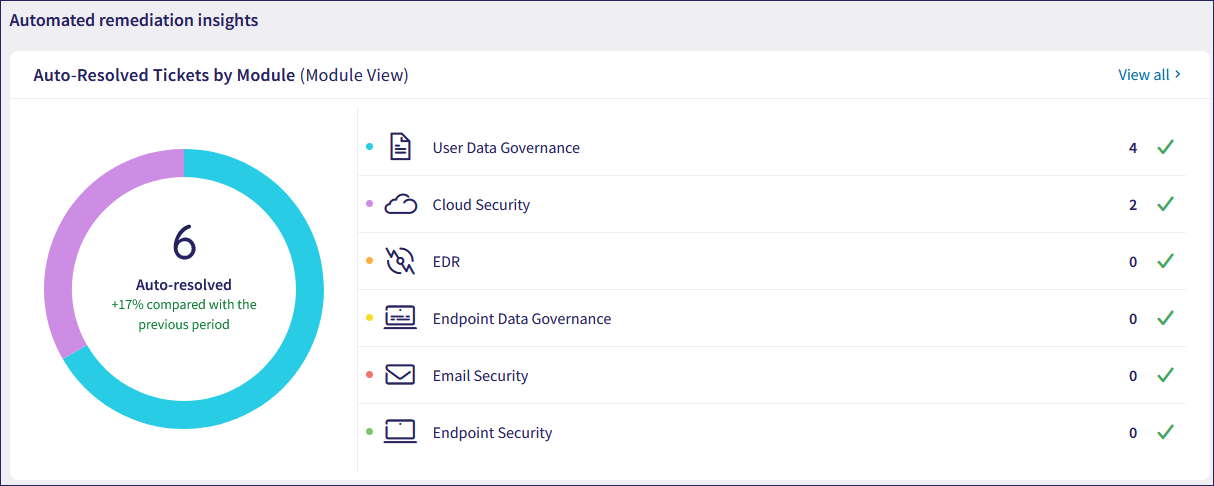
Use the Automated remediation insights section to review the number of tickets automatically closed by Coro during your selected date range, grouped by module, with trend data compared to the previous period.
The Automated remediation insights includes the following panel:
| Panel | Description | Actions |
|---|---|---|
| Auto-Resolved Tickets by Module | Shows a chart and list of tickets automatically resolved by Coro during your selected date range, grouped by module, with a percentage trend compared to the previous period. | Select View all to open the Ticket Log for all tickets that Coro closed in your workspace during your selected date range. Hover over a chart segment to see the number of tickets Coro automatically resolved for that module. |
In global view, the Automated remediation insights section includes the following panel:
| Panel | Description | Actions |
|---|---|---|
| Auto-Resolved Tickets by Module | Shows a chart and list of tickets automatically resolved by Coro across your organization's workspaces during your selected date range, grouped by module, with a percentage trend compared to the previous period. | Select View all to open the Global Ticket Log for all tickets that Coro closed across all workspaces during your selected date range. Hover over a chart segment to see the number of tickets Coro automatically resolved for that module. |
Use the Email security insights section to track domains that triggered the most Email Security tickets and assess changes in email threat activity.
You can view the Email security insights section in workspace view, and only if your workspace has Coro Email Security enabled.
The Email security insights section includes the following panel:
| Panel | Description | Actions |
|---|---|---|
| Top Domains Flagged for Suspicious Emails | Shows the email domains that triggered the highest number of Email Security tickets in your workspace during your selected date range. The panel displays each domain, the number of email security tickets Coro created, and the percentage trend compared to the previous period. | Select a domain to open the Ticket Log filtered by that domain. Select View all to open the Ticket Log for all Email Security tickets that Coro created in your workspace during your selected date range. |
