The Telemetry page collects and aggregates various types of monitored forensic information from devices, which users can use to conduct malware-related investigations more efficiently.
If a device loses network connectivity or the Agent is inactive, Coro EDR preserves your telemetry data. This saved data becomes accessible once the device re-establishes connection or the Agent resumes operation.
Coro retains customer telemetry data for 30 days.
Telemetry is built from:
macOS logs: macOS uses the application console to collect logs generated by your macOS device. Account activity logs collected in the application console are crucial for diagnosing device issues and potentially malicious user account activity.
Windows event logs: The Windows event log is a comprehensive and chronological record of system, security, and application notifications stored by the Windows operating system, which network administrators use to diagnose system problems and predict future issues.
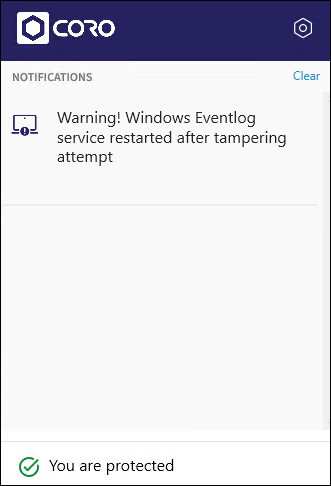
Coro safeguards against malicious attempts to disable the Windows Event Viewer, used to gather Windows event log telemetry data.
When a malicious process disables the Windows Event Viewer, the Agent immediately restarts the service, and the following notification appears:
When a process interacts with a telemetry source monitored by Coro EDR, the associated telemetry information of that process is available on the Telemetry page.
This article discusses the following topics:
To access the Telemetry page:
Select Telemetry:

Coro displays the Telemetry page:
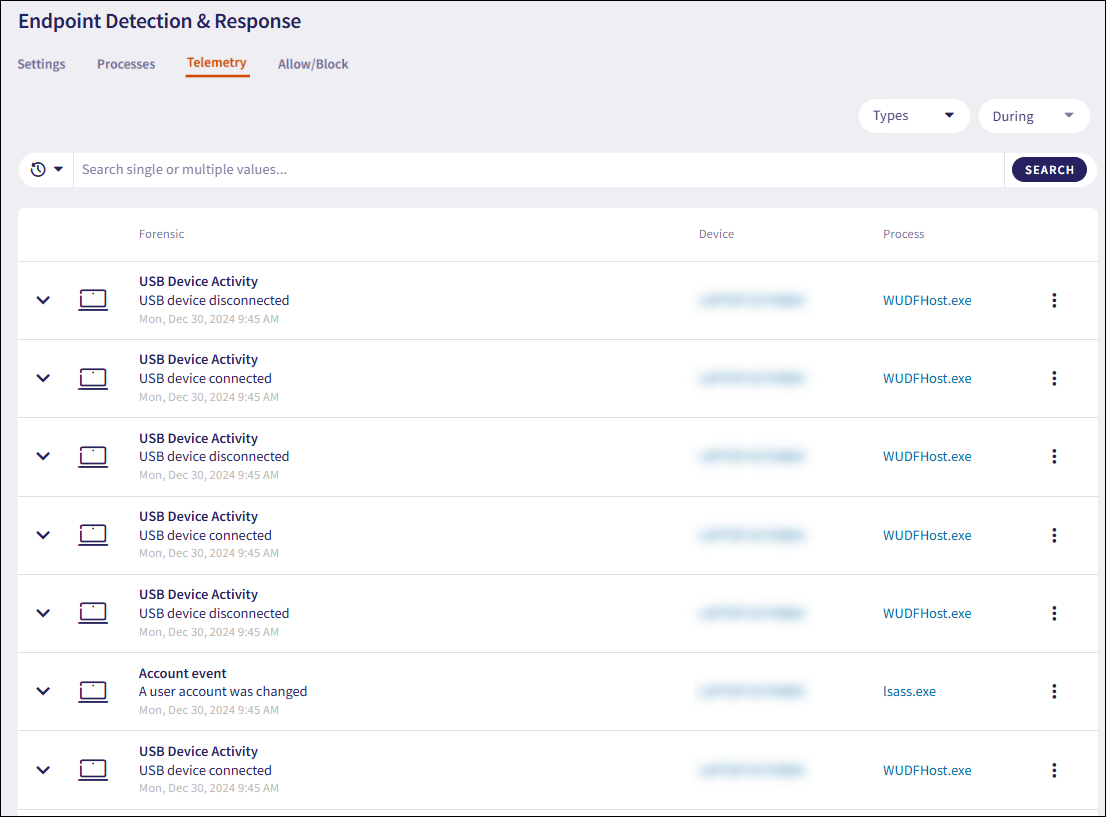
The forensic information is displayed as a list of monitored telemetry data. The list contains the following columns:
Forensic: The telemetry type, event name, and the timestamp when the event was created.
Device: The Coro ID of the device associated with the telemetry event. Select the device name to open the Devices page, filtered by the device ID.
Process: The process name related to the telemetry event.
The Telemetry page collects and monitors the following types of event log information:
Account event (Windows and macOS)
Registry key (Windows)
Scheduled task (Windows)
USB Device Activity (Windows)
Expand each type to display additional information. Filter for data types using the Type filter.
Account events are specific actions or activities related to user accounts and their interactions within a device’s operating system (OS) environment. These events are logged by the event log system of the OS, and are crucial for security monitoring, troubleshooting, and auditing purposes. Account events provide insights into user behavior, account management, and potential security threats.
Coro monitors Account events for both Windows and macOS devices.
The Telemetry page collects and monitors information related to the following account events:
A user account was created
A user account was enabled
An attempt was made to change an account's password
An attempt was made to reset an account's password
A user account was disabled
A user account was deleted
A user account was changed
The name of an account was changed
An account was successfully logged on
An account failed to log on
An account was logged off
A logon was attempted using explicit credentials
A user account was locked out

Expand an Account event record using the dropdown. Coro displays the following additional fields and process information:
User name: The user account associated with the forensic event.
Process name: The name of the process executable.
PID: The unique process ID that enables precise identification of the process.
Hash: The unique process identifier.
Command line: The full command used to start the process, including the path to the executable file and any passed arguments or parameters.
Parent process name: The name of the parent process executable that initiated another process.
Hash (parent): The unique parent process identifier that initiated another process.
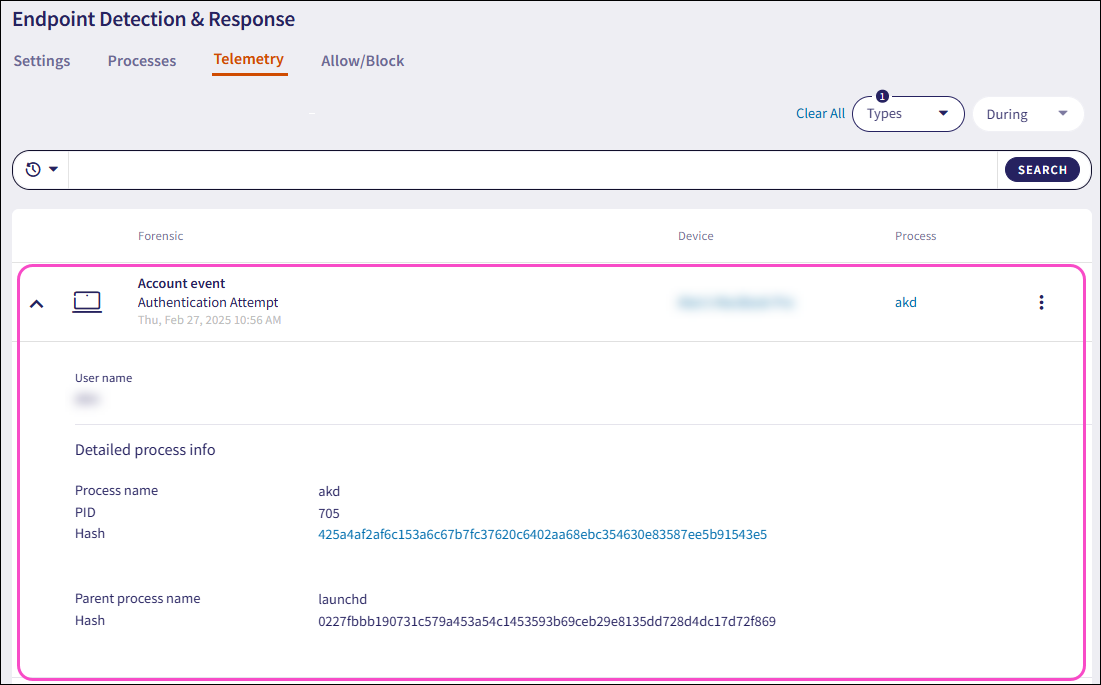
Coro displays additional fields depending on the Account event type and the OS of the device.
Registry keys are hierarchical data structures in the Windows operating system registry. They serve as containers that store configuration settings and information about software, hardware, and system preferences. Each key can contain subkeys and values, facilitating the organization and retrieval of crucial system data.
Coro monitors Registry keys events for Windows devices.
The Telemetry page collects and monitors information related to the addition, modification, and deletion of the following Registry keys:
HKEY_LOCAL_MACHINE\Software\Microsoft\Windows NT\CurrentVersion\Winlogon
HKLM\SYSTEM\CurrentControlSet\Control\Session Manager\BootExecute
HKLM\System\CurrentControlSet\Services
HKLM\System\CurrentControlSet\Services
HKLM\Software\Microsoft\Windows\CurrentVersion\RunServicesOnce
HKCU\Software\Microsoft\Windows\CurrentVersion\RunServicesOnce
HKLM\Software\Microsoft\Windows\CurrentVersion\RunServices
HKCU\Software\Microsoft\Windows\CurrentVersion\RunServices
HKLM\SOFTWARE\Microsoft\Windows NT\CurrentVersion\Winlogon\Notify
HKLM\Software\Microsoft\Windows NT\CurrentVersion\Winlogon\Userinit
HKCU\Software\Microsoft\Windows NT\CurrentVersion\Winlogon\Shell
HKLM\Software\Microsoft\Windows NT\CurrentVersion\Winlogon\Shell
HKLM\SOFTWARE\Microsoft\Windows\CurrentVersion\ShellServiceObjectDelayLoad
HKLM\Software\Microsoft\Windows\CurrentVersion\RunOnce
HKLM\Software\Microsoft\Windows\CurrentVersion\RunOnceEx
HKLM\Software\Microsoft\Windows\CurrentVersion\Run
HKLM\Software\Microsoft\Windows\CurrentVersion\RunEx
HKCU\Software\Microsoft\Windows\CurrentVersion\Run
HKCU\Software\Microsoft\Windows\CurrentVersion\RunOnce
HKLM\Software\Microsoft\Windows\CurrentVersion\Policies\Explorer\Run
HKCU\Software\Microsoft\Windows\CurrentVersion\Policies\Explorer\Run
HKCU\Software\Microsoft\Windows NT\CurrentVersion\Windows\load
HKLM\Software\Microsoft\Windows NT\CurrentVersion\Windows
HKLM\SOFTWARE\Microsoft\Windows\CurrentVersion\Explorer\SharedTaskScheduler (XP, NT, W2k only)
HKLM\Software\Microsoft\Windows NT\CurrentVersion\Windows\AppInit_DLLs

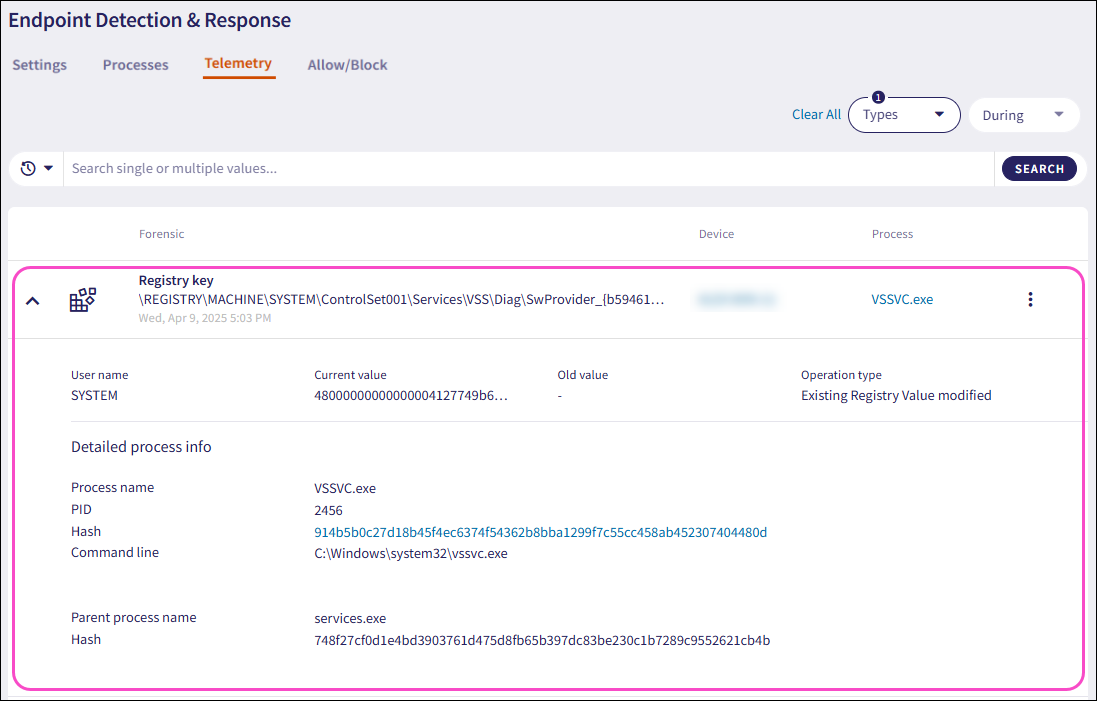
Expand a Registry key record using the dropdown. Coro displays the following additional fields and process information:
Current value: The new registry key value, classification symbol, and timestamp.
Old value: The old registry key value.
Operation type: The type of operation performed with the registry key value. These operations are:
- New Registry Value created
- Registry Value deleted
- Existing Registry Value modified
Process name: The name of the process executable.
PID: The unique process ID that enables precise identification of the process.
Hash: The unique process identifier.
Parent process name: The name of the parent process executable that initiated another process.
Hash (parent): The unique parent process identifier that initiated another process.
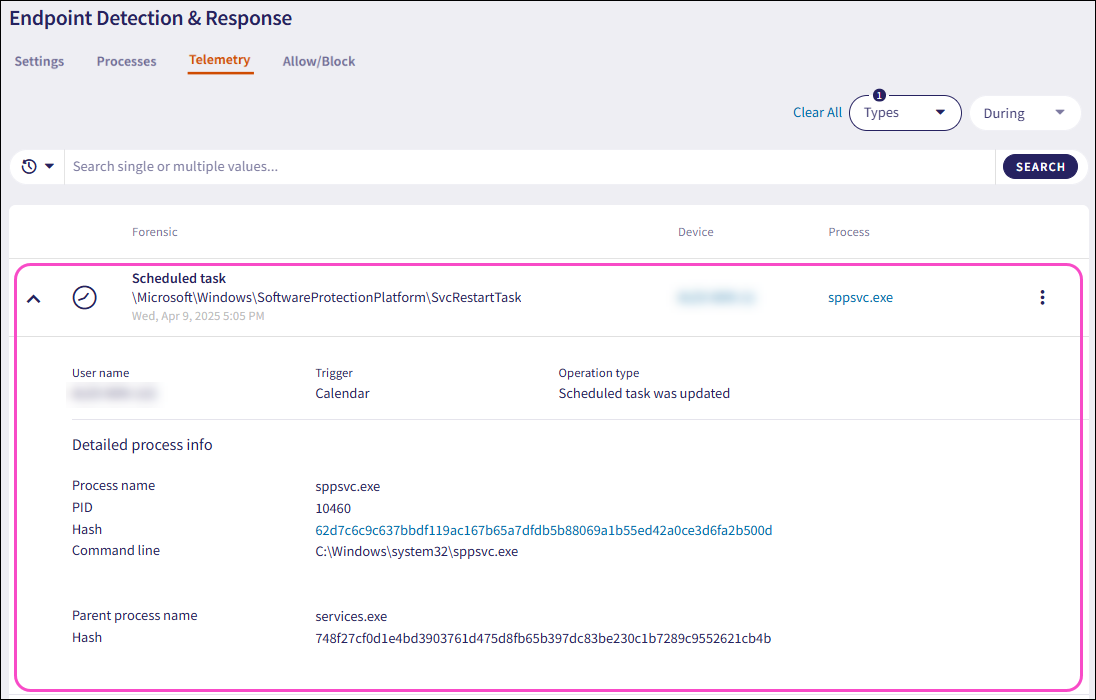
Scheduled Tasks are automated processes that run on a predetermined schedule in operating systems or applications. They perform specific actions at regular intervals, such as hourly, daily, or weekly, without manual intervention. These tasks are crucial for automating routine operations, data backups, updates, and maintenance, enhancing efficiency and ensuring timely execution of critical functions.
Coro monitors Scheduled task events for Windows devices.
The Telemetry page collects and monitors information related to the addition of Scheduled tasks:

Expand a Scheduled task record using the dropdown. Coro displays the following additional fields and process information:
User name: The user account associated with the forensic event.
Action: The executable action of the task.
Trigger: Specifies the action which initiates the event, for example, Calendar specifies a calendar based action.
Operation type: The type of operation performed with the task, for example, Scheduled task was updated.
Process name: The name of the process executable.
PID: The unique process ID that enables precise identification of the process.
Hash: The unique process identifier.
Command line: The full command used to start the process, including the path to the executable file and any passed arguments or parameters.
Parent process name: The name of the parent process executable that initiated another process.
Hash: (parent): The unique parent process identifier that initiated another process.
Command line: (parent): The full parent command used to initiate the event that triggered another process.
Coro EDR automatically decodes base64-encoded command lines, rendering them understandable for the user.
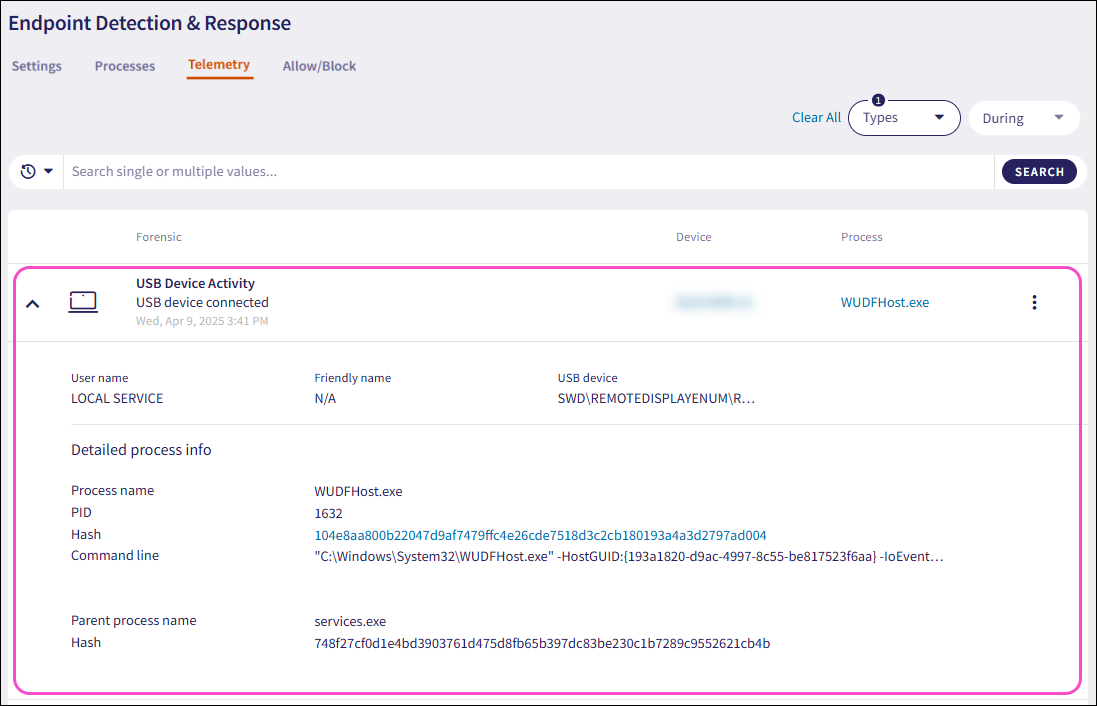
Monitoring USB device activity provides insight that supports investigations and mitigates threats by identifying potential sources of malware infections. For example, if malware is suspected to have infected a device via a USB drive, admin users with sufficient permissions can use this forensic information to respond to the incident and trace the infection’s origin.
Coro monitors USB Device Activity events for Windows devices.
The Telemetry page collects and monitors information related to the following USB device activities:
USB device connected
USB device disconnected

Expand a USB Device Activity record using the dropdown. The following additional fields and detailed process information displays:
User name: The user account associated with the forensic event.
Friendly name: The descriptive label for the USB device.
USB device: The unique USB device identifier.
Process name: The name of the process executable responsible for managing drivers and communication with the connected USB device.
PID: The unique process ID that enables precise identification of the process.
Hash: The unique process identifier.
Command line: The full command used to start the process, including the path to the executable file and any passed arguments or parameters.
Each process listed in Telemetry includes a set of actions you can apply to a monitored data record:
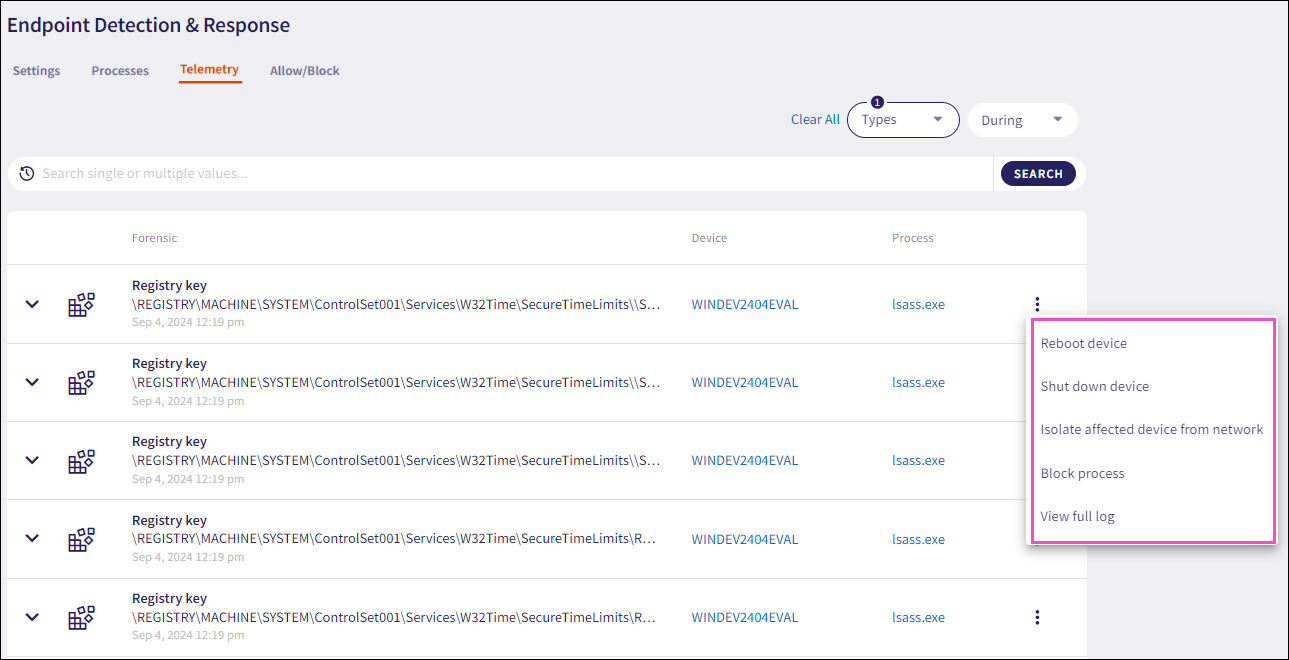
The following telemetry actions are available:
Isolate affected device from network (applicable to Registry keys and Scheduled tasks): Used in the case of severe attacks. The action isolates selected devices from the network. An isolated device cannot communicate with any resource on the network or the internet. The Coro process remains functional in order to communicate with the Coro server.
Reconnect isolated devices to the network from the Devices page.
You can isolate a process if at least one of the associated devices has either:
MacOS agent v2.1 or higher installed.
Windows agent v2.2 or higher installed.
Shut down devices: Shuts down selected devices.
Reboot devices: Reboots selected devices.
Block process: Blocks a process and adds an item to the list on the Allow/Block page of the Endpoint Security module:

For further information on blocking processes, see EDR Allow/Block lists and Endpoint Security Allow/Block lists
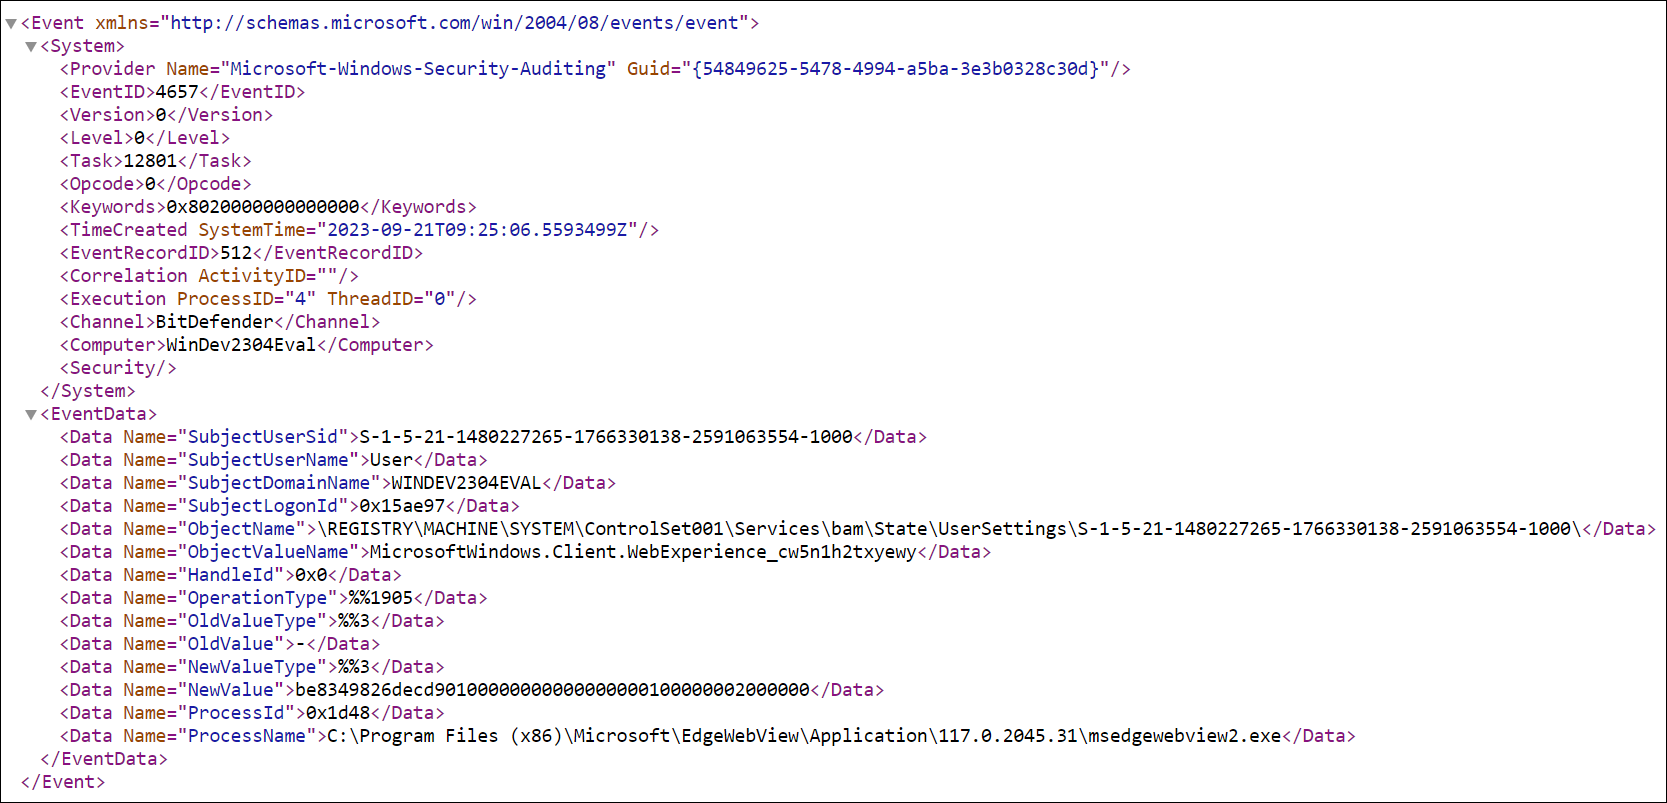
View full log: Displays the raw XML (for Windows) and JSON (for macOS) log related to the telemetry entry, as received from the Agent:
Filter the Telemetry page records by using the following two filters:
The telemetry Types filter enables you to filter telemetry records by:
Registry key
Scheduled task
Account events
USB Device Activity

The telemetry time period filter enables you to filter telemetry records by specific dates and time intervals.
To apply a time period filter:
Select the During dropdown.
Coro displays a date and time picker:
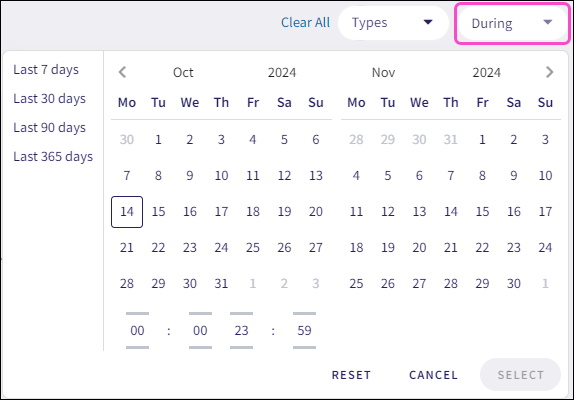
Select the start and end date:
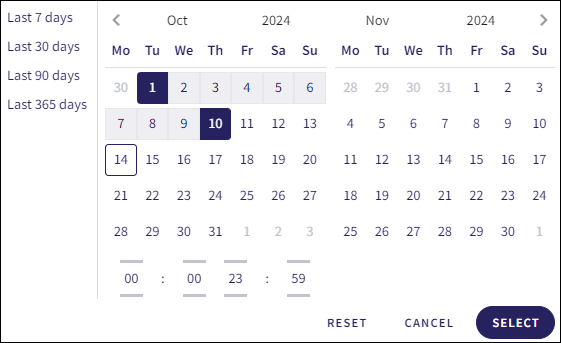
(Optional) Use the time picker to refine your search by adjusting the hour or minute value:


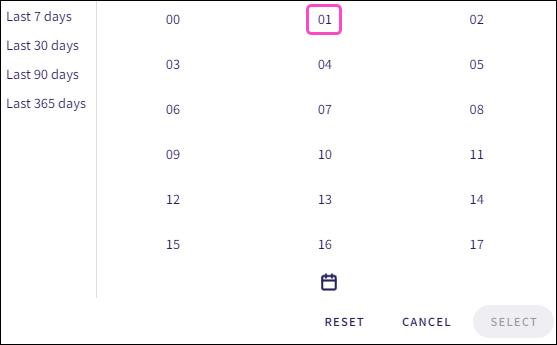
Alternatively, select the current hour or minute value:

Select the hour or minute value:
Select SELECT:
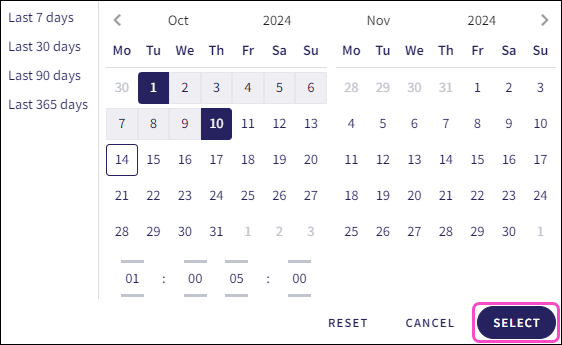
Coro filters the telemetry records, displaying the current filter values in the During dropdown:
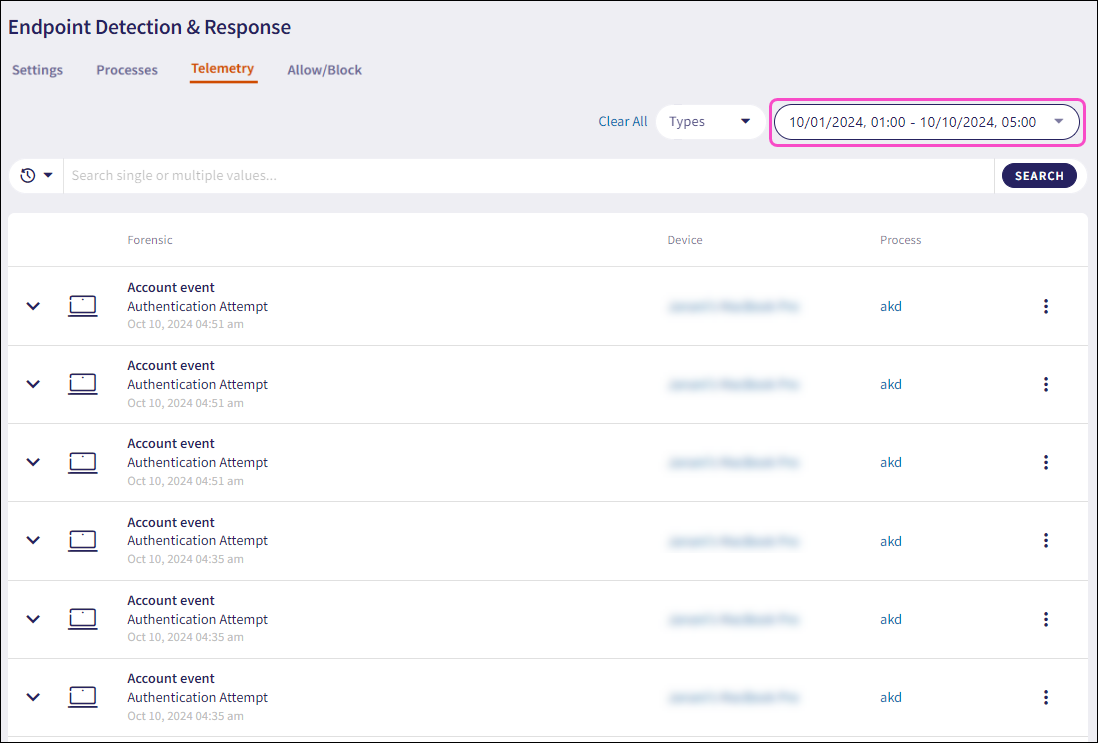
The Search field enables you to search and filter telemetry records using two methods:
A prefixed search enables you to search by one or more telemetry fields or forensic values.
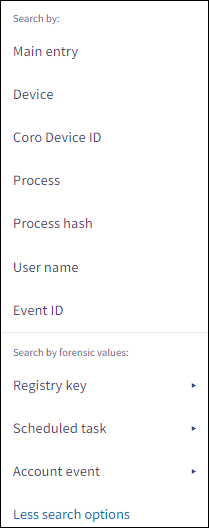
Search by the following prefixed telemetry fields:
Main entry: The forensic event.
Device: The name of the device linked to the forensic record.
Coro Device ID: The device ID associated with the device.
Process: The name of the process.
Process hash: The unique process identifier.
User name: The user account associated with the forensic event.
Event ID: The ID associated with a specific event.
Select More search options to further refine your search according forensic values corresponding to a specific telemetry type:
Registry key:
Current value: The current registry key value.
Old value: The previous registry key value.
Operation type: The action performed on the registry key.
Scheduled task:
Action: The specific task or action being executed by the scheduled task.
Operation type: the specific action that was performed on the scheduled task.
Account event:
Target account: The user or system account associated with the account event.
Account domain: The domain where the user account exists.
To perform a prefixed search:
Select the search field and then select the prefixed search item (telemetry property or forensic value):
Select the search operator from the Add operator dropdown:

Enter the value for the telemetry field or forensic value and then select Enter.
Coro formats each entered value as a chip:

Select the X on an individual chip to remove it from the search field.
Select SEARCH:

Coro filters the telemetry list by the searched criteria:
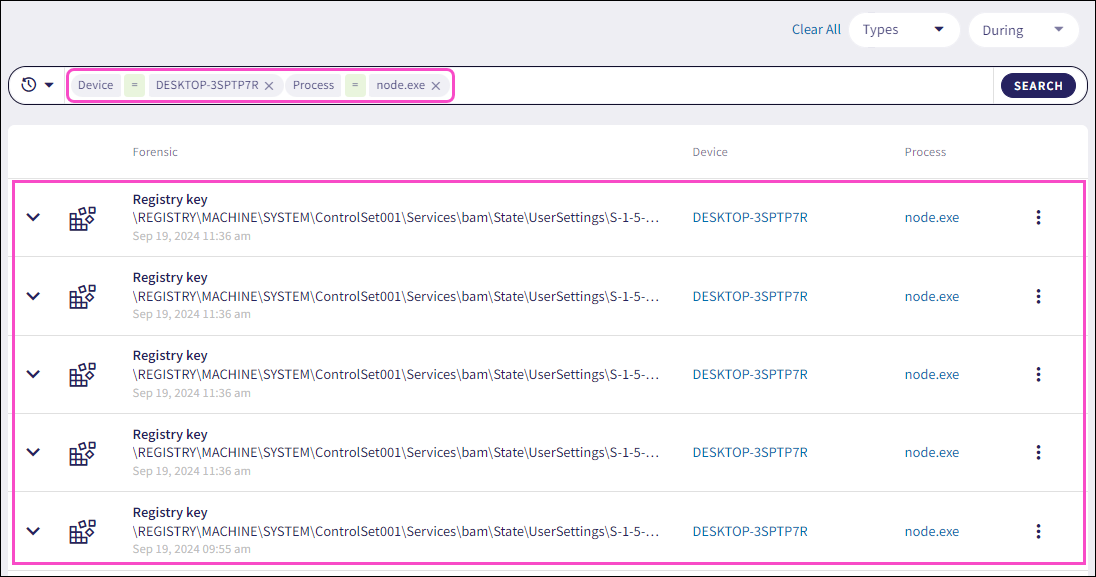
Prefixed searches use exact matches for the selected prefixed term value entered.
Free text search allows you to search telemetry data without prefixed terms, filtering across multiple fields and forensic values to locate specific terms.
To perform a free text search:
Select the search field, enter one or more forensic values, and select Enter.
Coro formats each entered value as a chip:

Select the X on an individual chip to remove it from the search field.
Select SEARCH:

Coro filters the telemetry list by the searched criteria:
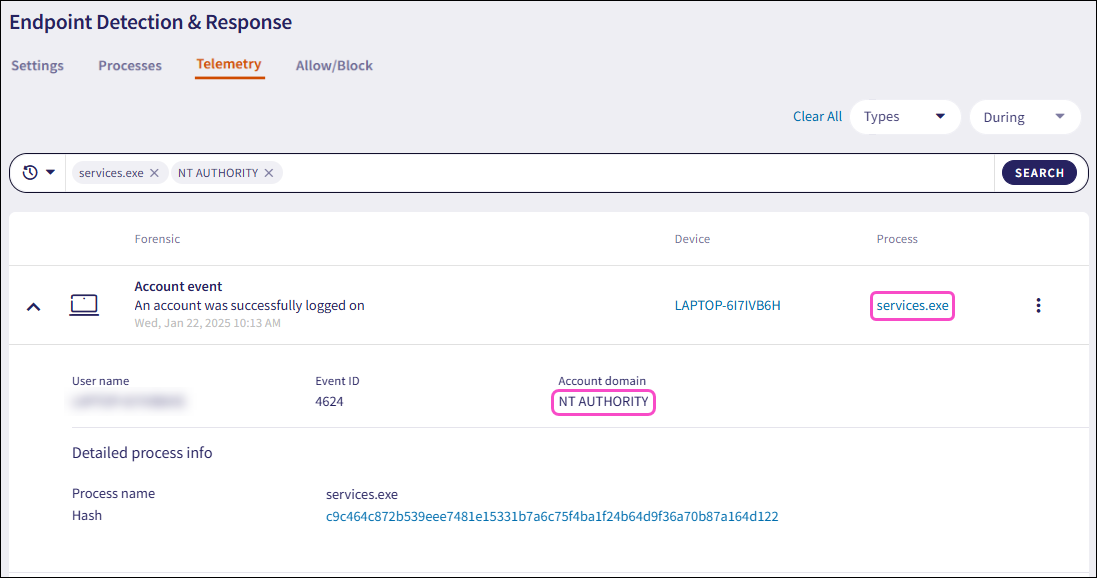
Free text searches support partial matches.
Coro saves your five most recent searches, allowing you to select and reapply them as needed.
To apply a recent search:
Select the Recent Searches dropdown:

Select the search:
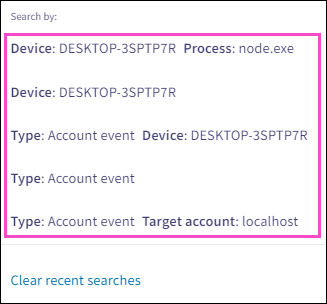
Coro formats each recent search value as a chip in the search field, applies the selected search, and filters the telemetry list based on the criteria:

Select Clear recent searches from the Recent Searches dropdown to remove all previous recent search entries.