Coro provides insight into your workspace activity through reports. Reports include activity across the workspace, or summary information and data for individual modules or protection components.
The reports offered through this page vary according to the modules and services in your subscription.
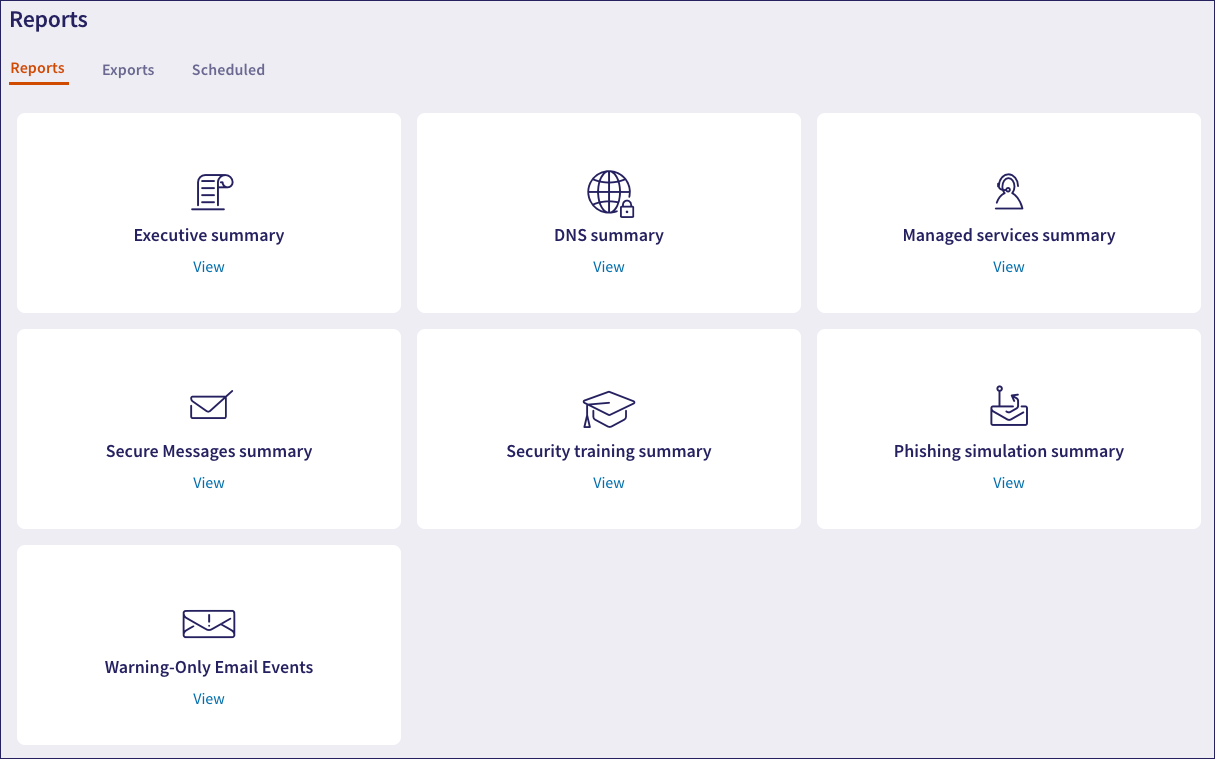
Coro provides the following reports:
| Report | Description |
|---|---|
Executive summary | A detailed overview of the security status and activities within a workspace. It features a dynamic structure that adapts to the specific modules enabled in the workspace and the tickets generated within the selected reporting period. The report is divided into several sections, including:
You can create a schedule for generating a PDF of this report on a regular basis. |
DNS summary | A summary of the DNS activity in a workspace. The report is divided into several sections, including:
|
| Managed services summary | A summary of the tickets resolved through Coro's managed services team. |
| Secure Messages summary | A summary of the secured messages sent by protected users. |
Security training summary | A summary of Security Awareness Training courses scheduled, completed, and overdue for your protected users. The report is divided into several sections:
Assigned courses become overdue after 30 days. |
Phishing simulations summary | A summary of phishing simulation activity and engagement through the Security Awareness Training module. The report is divided into several sections:
|
Warning-Only Email Events | A summary of all emails received by protected users that resulted in the display of a warning banner or label. Since Coro does not generate a ticket for warning-only events, this report offers visibility into how often these risk indicators appear and which users are most impacted. The report is divided into the following sections:
|
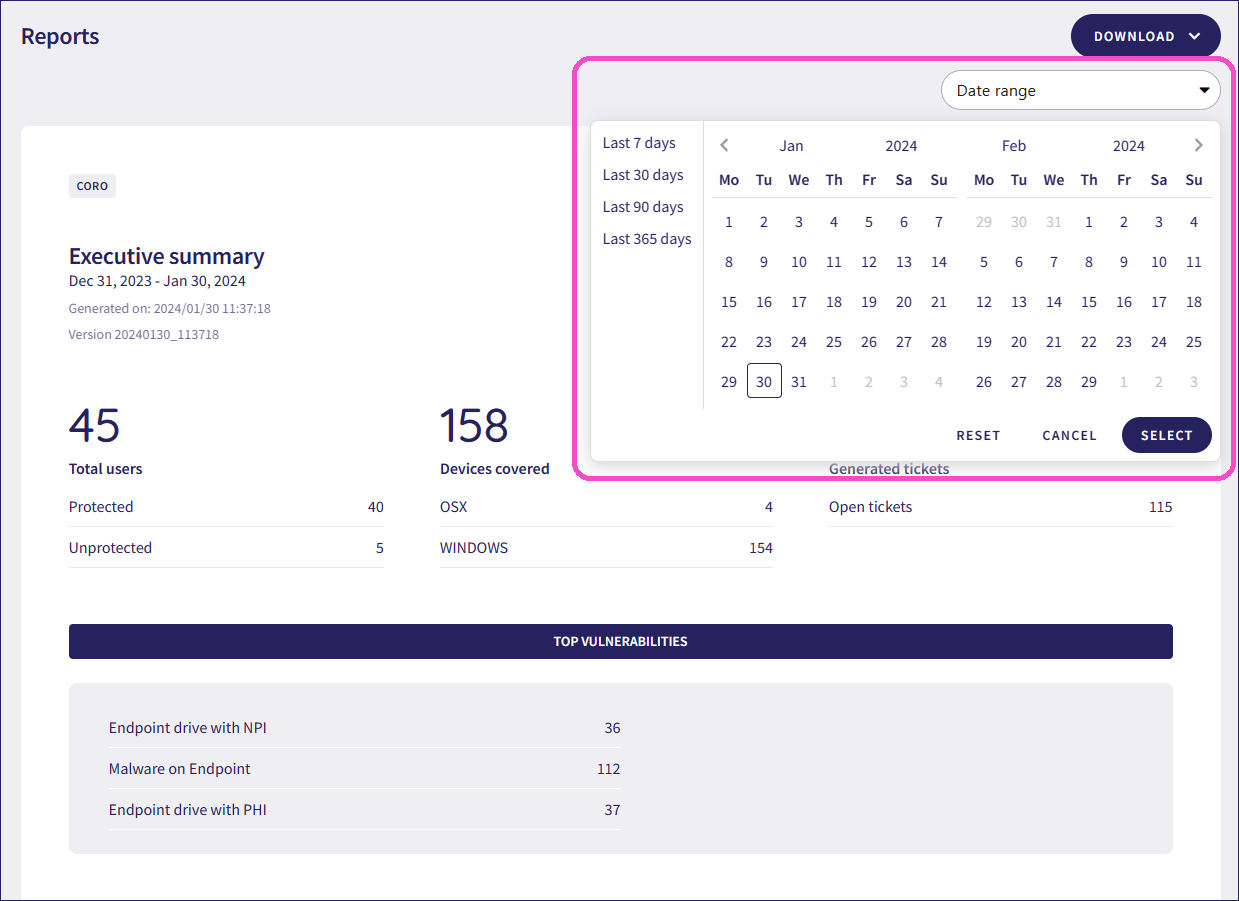
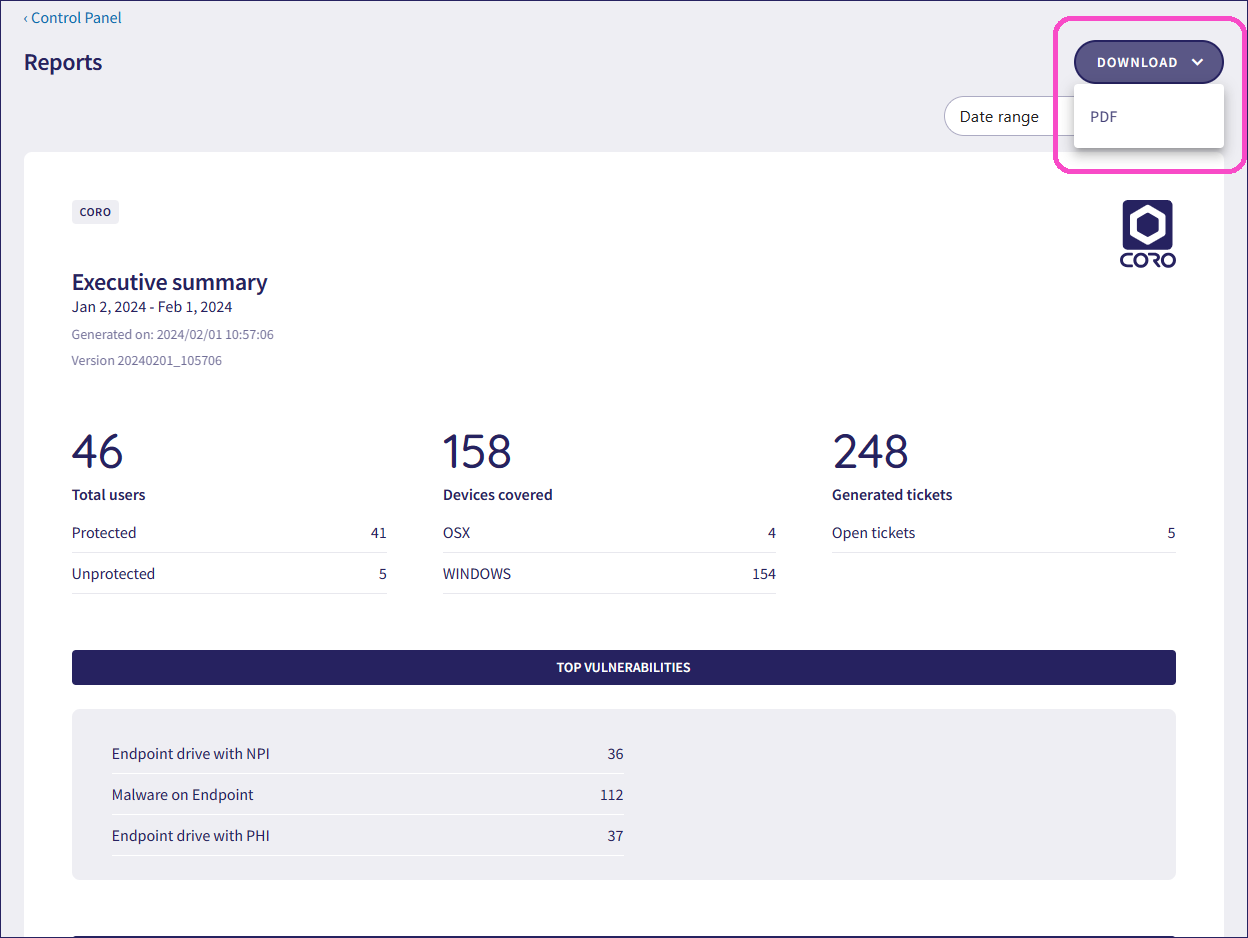
For each report, Coro enables you to select a predefined or custom date range and offers the option to download the report as a PDF.
To view and run reports:
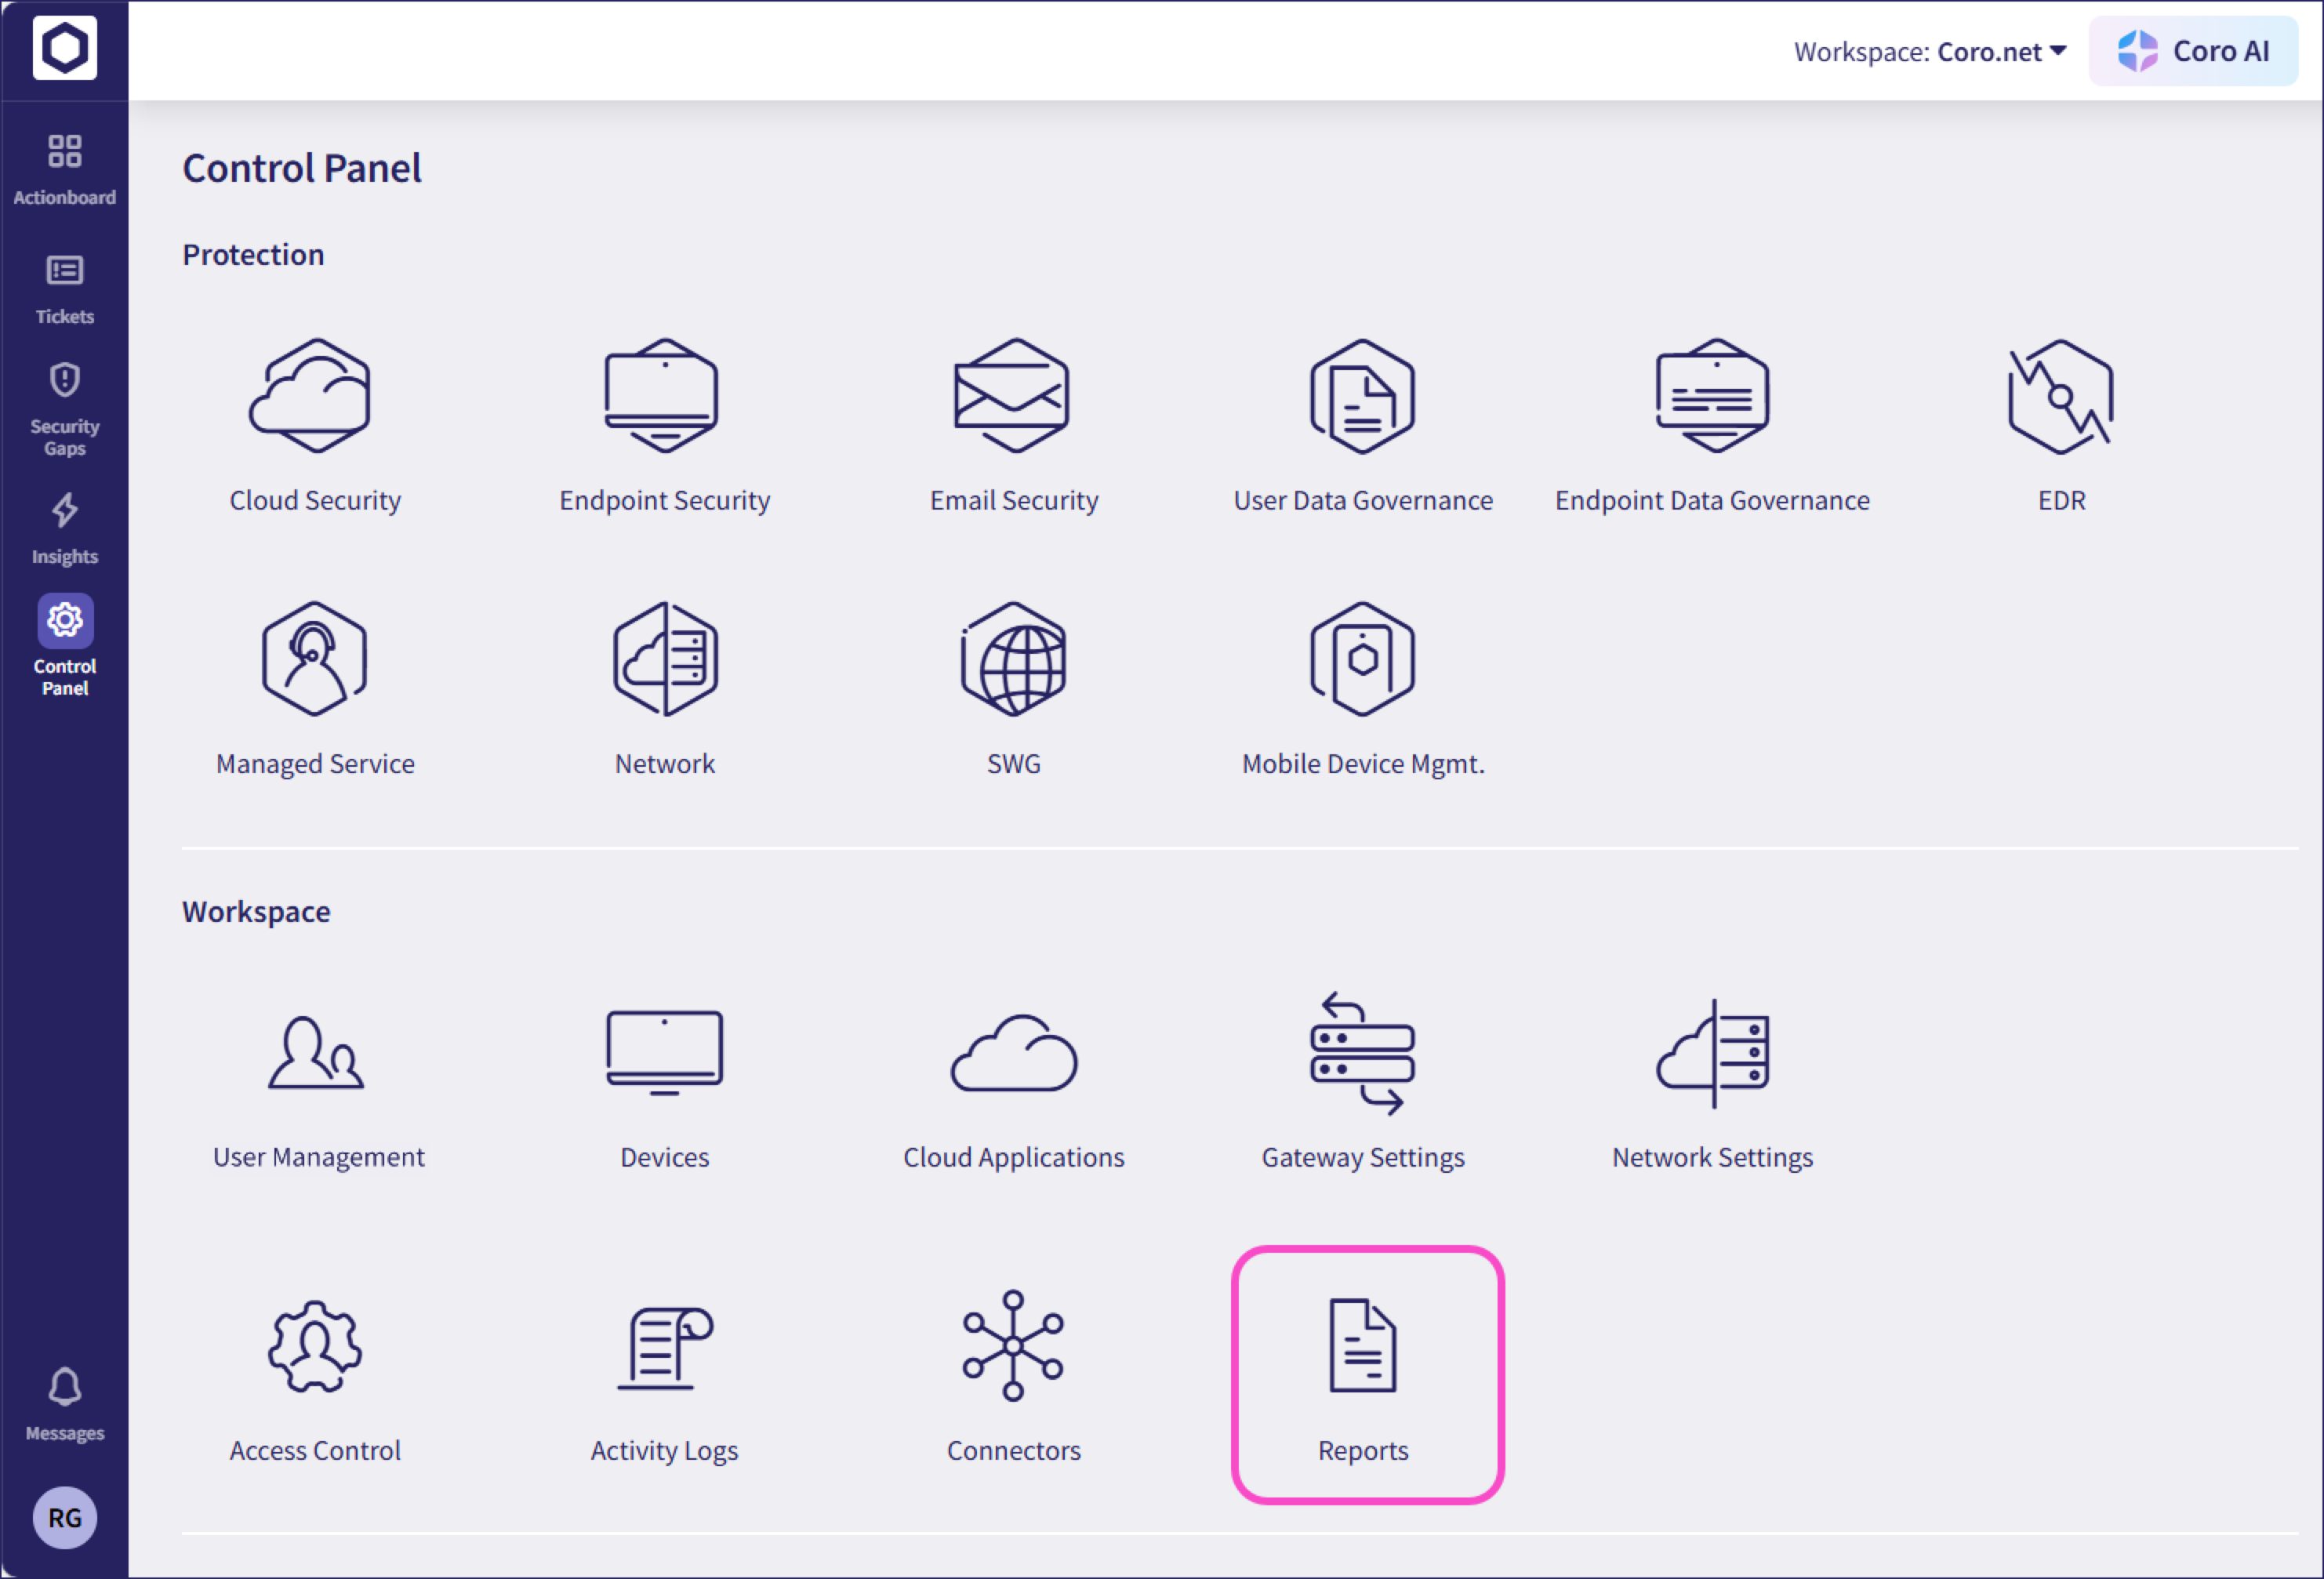
Navigate to Control Panel > Reports:

Select a report:

Coro displays the report with a default time range of the previous 30 days.
To filter by date range, select Date range:

To download the report, select Download > PDF:
